


Agricultural Literacy Curriculum Matrix
Lesson Plan
Populations
Grade Level
Purpose
Students evaluate the growth of human populations across time, analyze graphic data to make predictions about future population growth, research country statistics to evaluate demographic transition, and participate in a simulation of a village reliant on subsistence farming. Students begin to develop a sense for the Earth's carrying capacity and how humans have impacted it. Grades 9-12
Estimated Time
Materials Needed
Engage:
- World Population video
- Human Populations Through Time student worksheet, 1 per student
Activity 1: Population Growth
- Population Growth student handout, 1 per student
- Electronic device for research
Activity 2: Population Age Structures
- Population Age Structures student handout, 1 per student
Activity 3: Demographic Transition
- A global food crisis may be less than a decade away | Sara Menker video
- Demographic Transition student handout, 1 per student
Activity 4: Farming for the Future
- Farming for the Future student handout, 1 copy per group
- One six-sided die for each group
- Data sheets, 1 copy per group
- Effects of Malnutrition chart, 1 copy per group
- Impact Cards for Round 1 and Round 2, 1 copy per class
- Impact Cards for Round 3, 1 copy per class
- Photos of the crops that are being planted (Many students are unfamiliar with these crops.)
Vocabulary
arable: land used or suitable for growing crops
climate: the prevailing weather conditions in a specific area over a long period of time
climate change: a change in global or regional climate patterns which can include increased temperatures and extreme weather events such as droughts, floods, etc.
commodity farming: a system where farmers sell their grain or livestock in one state to be made into food products that will be distributed across the region or even the world
food waste: food that is not eaten
infrastructure: the basic equipment and structures (such as roads and bridges) that are needed for a country, region or organization to function properly
population age structure: the proportion of the population (and of each gender) at each age level
subsistence farming: the practice of small-scale agriculture for direct consumption by individuals, families, and small communities
urbanization: a population shift from rural to urban areas
Did You Know?
- Currently, one billion people cannot even satisfy their basic needs in terms of food energy.1
- According to most estimates, there will be over 9.5 billion people on the planet in 2050.
- Boosting farm productivity is an essential instrument to alleviating poverty and reducing hunger.
Background Agricultural Connections
 According to most estimates, there will be over 9.5 billion people on the planet in 2050. Many experts suggest that growers will have to produce more food in the next 50 years than has been grown in the past 10,000, which would mean doubling current production on the same amount of land. Yield increases have begun to slow (see USDA graph). Therefore, this demand will require development of new technologies, new techniques, and new environmental practices.
What are the limits to food production possibilities? The amount of arable land may decrease if climates continue to change. Water is limited around the world and the places that are most productive are not necessarily in the areas where food is most needed. Fossil fuels, even with the addition of ethanol, run tractors while fertilizers and pesticides are also energy intensive to create. Therefore, food production is closely tied to fuel costs and availability.
Another concern is the infrastructure that is necessary to get food to markets before it spoils. In many less economically-developed countries, there is no system to get the food to market and storing it is not a viable option due to fungus and pests spoiling it. Soil is also vulnerable to erosion, desertification (once fertile land becomes arid), salinization (build-up of salts in the soil from overirrigation), and water-logging (saturation of soil by groundwater).
One of the largest problems in the developed world is food waste. Some of the crop is lost in the field to pests (about 30%), some is left during the harvest (10–20%), and in the U.S., it is estimated that consumers throw away as much of 50% of their food. Population pressures are driving today’s food production demand. While the need to feed a growing population will continue, factors such as decreasing infant mortality rates, reducing the need for children to work, providing women with educational opportunities and access to family planning will improve the standard of living in countries worldwide and increase the demand for food. With 9 billion eaters, the agriculture industry, made up of large-scale farmers, local food producers, entrepreneurs, agricultural scientists, and engineers will all become allies in meeting future food demands.
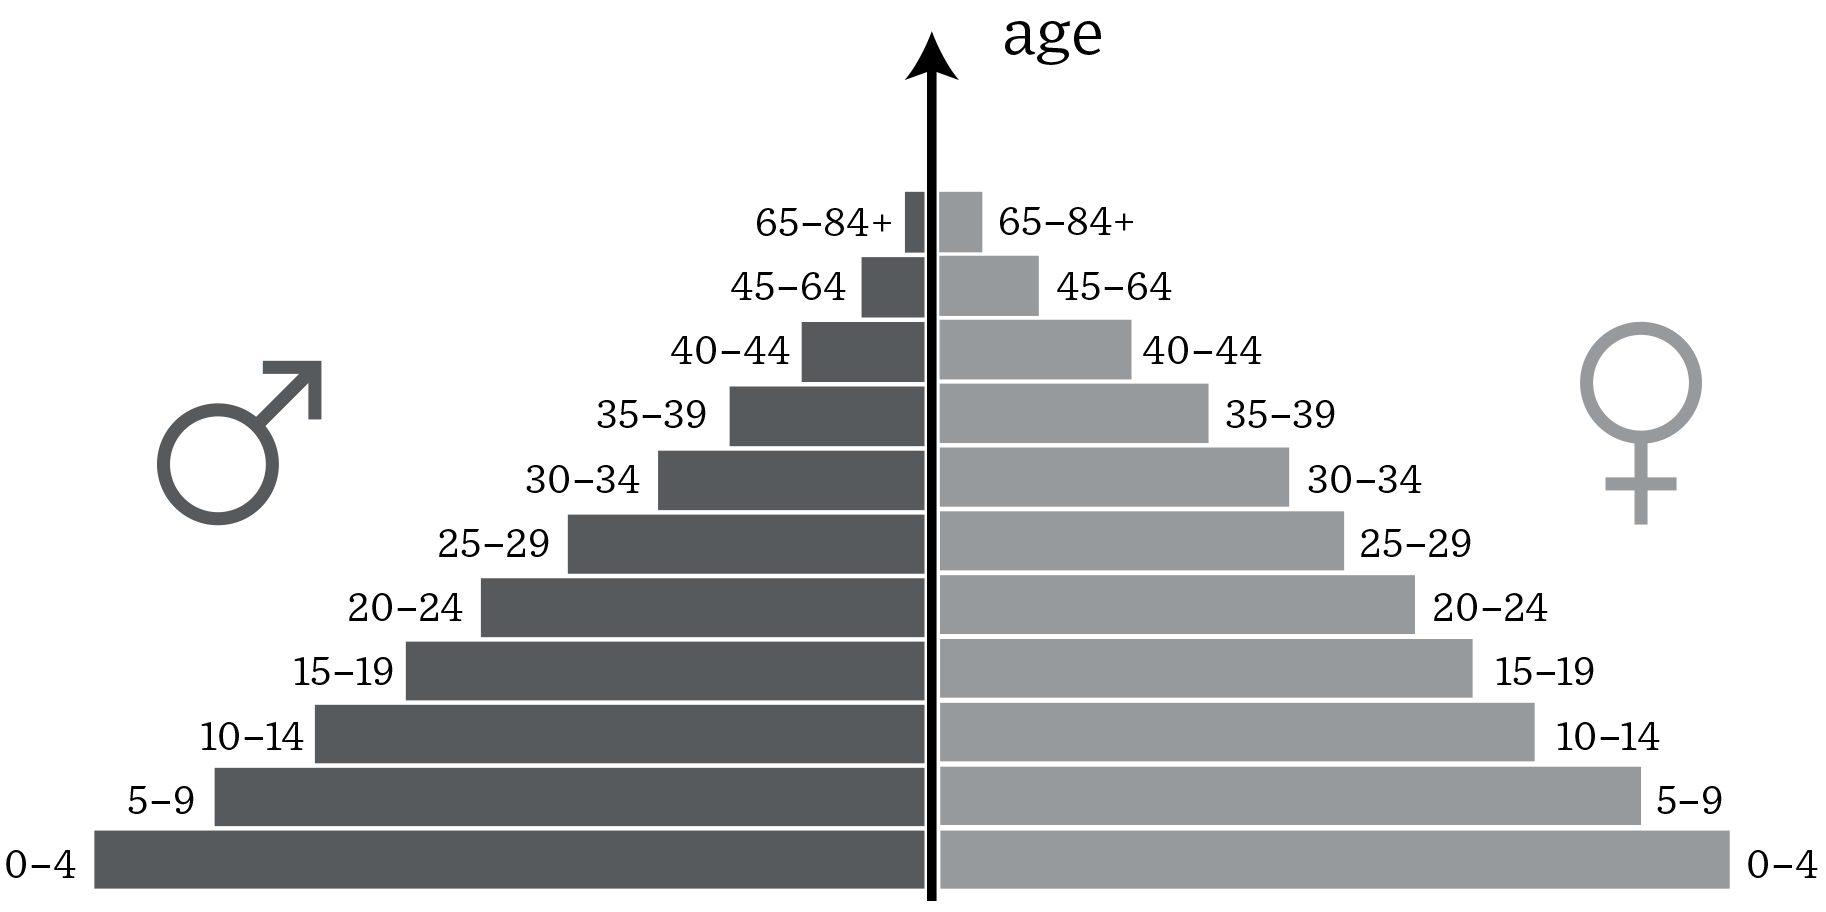
A population age structure diagram is the proportion of the population (and of each gender) at each age level. (Each level in the above graphic represents an age group in increasing order, youngest at the bottom and oldest at the top.)
By 2050 the world’s population will reach 9.8 billion, about 30 percent higher than today’s population. Nearly all of this population increase will occur in developing countries. Urbanization will continue at an accelerated pace, and about 70 percent of the world’s population will be urban (compared to 49 percent today). In order to feed this larger, more urban population, food production must increase by 60–70 percent. Urbanization brings with it changes in lifestyles and consumption patterns. In combination with income growth, it may accelerate changes in the diets of people in developing countries. Currently, these populations depend heavily on grains such as maize, wheat, and rice. While the shares of grains and other staple crops will be declining, those of vegetables, fruits, meat, dairy, and fish will increase. In response to this change, these groups will be increasingly buying food from markets where there is more of a concentration on secondary consumers (animals that eat the grains). However, rural areas will still be home to the majority of the poor and hungry for quite some time. Currently, one billion people cannot even satisfy their basic needs in terms of food energy.1
Feeding these additional billions by 2050 is a formidable challenge, with tighter resource constraints (land, water, soil), the demand to limit agriculture’s ecological footprint, and the impact of climate change. Many have argued that distribution is the problem and if we could solve that, there is enough production to feed the world population now.2 Current global food availability is not sufficient to feed the world in 2050, even if all the food calories available in the world today were equally distributed across the projected population in 2050. With the changes that will be demanded by a growing urban population (as described above), this idea is not feasible. Boosting farm productivity is an essential instrument to alleviating poverty and reducing hunger. Reducing food waste and encouraging less resource-intensive diets in developed countries (particularly lower meat consumption) are desirable goals, but they do not reduce the need to invest in increasing agricultural production and improving agricultural productivity in both developed and developing countries.3
Over 43% of the world labor force in 1991 was dedicated to agriculture, but as of 2018, it is down to about 25%, with the number much higher in less-developed countries, but much lower (about 2%) in more developed countries like the United States. Mechanization and technology has accounted for much of the change, yet there are many countries with over 50% of their labor force still dedicated to a subsistence farming method that has been practiced for thousands of years. This method relies on growing enough food for the family or village to get them to the next growing season and is not always successful.
The infrastructure that exists in the United States, allows farmers to sell their grain or livestock in one state to be made into food products that will be distributed across the region or even the world. This is called commodity farming and does not exist in less-developed countries. In those countries, access to electricity can be a large barrier to drying grains so they do not spoil. Trucks and roadways may be lacking that would allow for travel to a regional market.
See these resources for additional information:
Engage
- Ask students, “How can we meet the demands of a growing population?” Gather information from students about what they perceive the "demands" might be. Give each student a Human Populations Through Time student worksheet to record their thoughts.
- Show students the World Population video.
- After the video is over, have students brainstorm a list of questions they have about about the world's population. Give students 30-60 seconds to brainstorm individually. Then, have students share their questions within small groups (3-4 students) for two or three minutes. Have groups share their questions one-by-one until all questions are shared. Keep note of the questions, as they will guide the rest of the lesson. Possible questions include:
- How many people are added in a minute?
- How many people are added in our state?
- How many people are added in the United States?
- Where are all of these people?
- What is the rank of countries by population?
- Why are some countries growing faster than others?
- What are the effects of this growth?
- What effects do the growth of human populations have on ecosystems?
- Do we have enough food?
- Can we grow enough food?
- When did we grow so large as a human population?
- If no one brings up food or food production, add your own questions as prompts:
- Do we have enough food to feed everyone?
- Where are the people and where is the food?
- How can we feed over 9.5 billion people in 2050, and what happens along the way?
- Circle the questions that relate to the sheer number of people and the rate at which the population has grown. Inform students that they will continue investigating these questions.
Explore and Explain
Activity 1: Population Growth
How quickly has human population increased over time? What events have impacted the growth of human populations through time?
- Give each student one copy of the Population Growth handout.
- Instruct students to follow the instructions in the Procedure section of the handout. Students will need to explore the World Population History website and then create a table to answer the following questions:
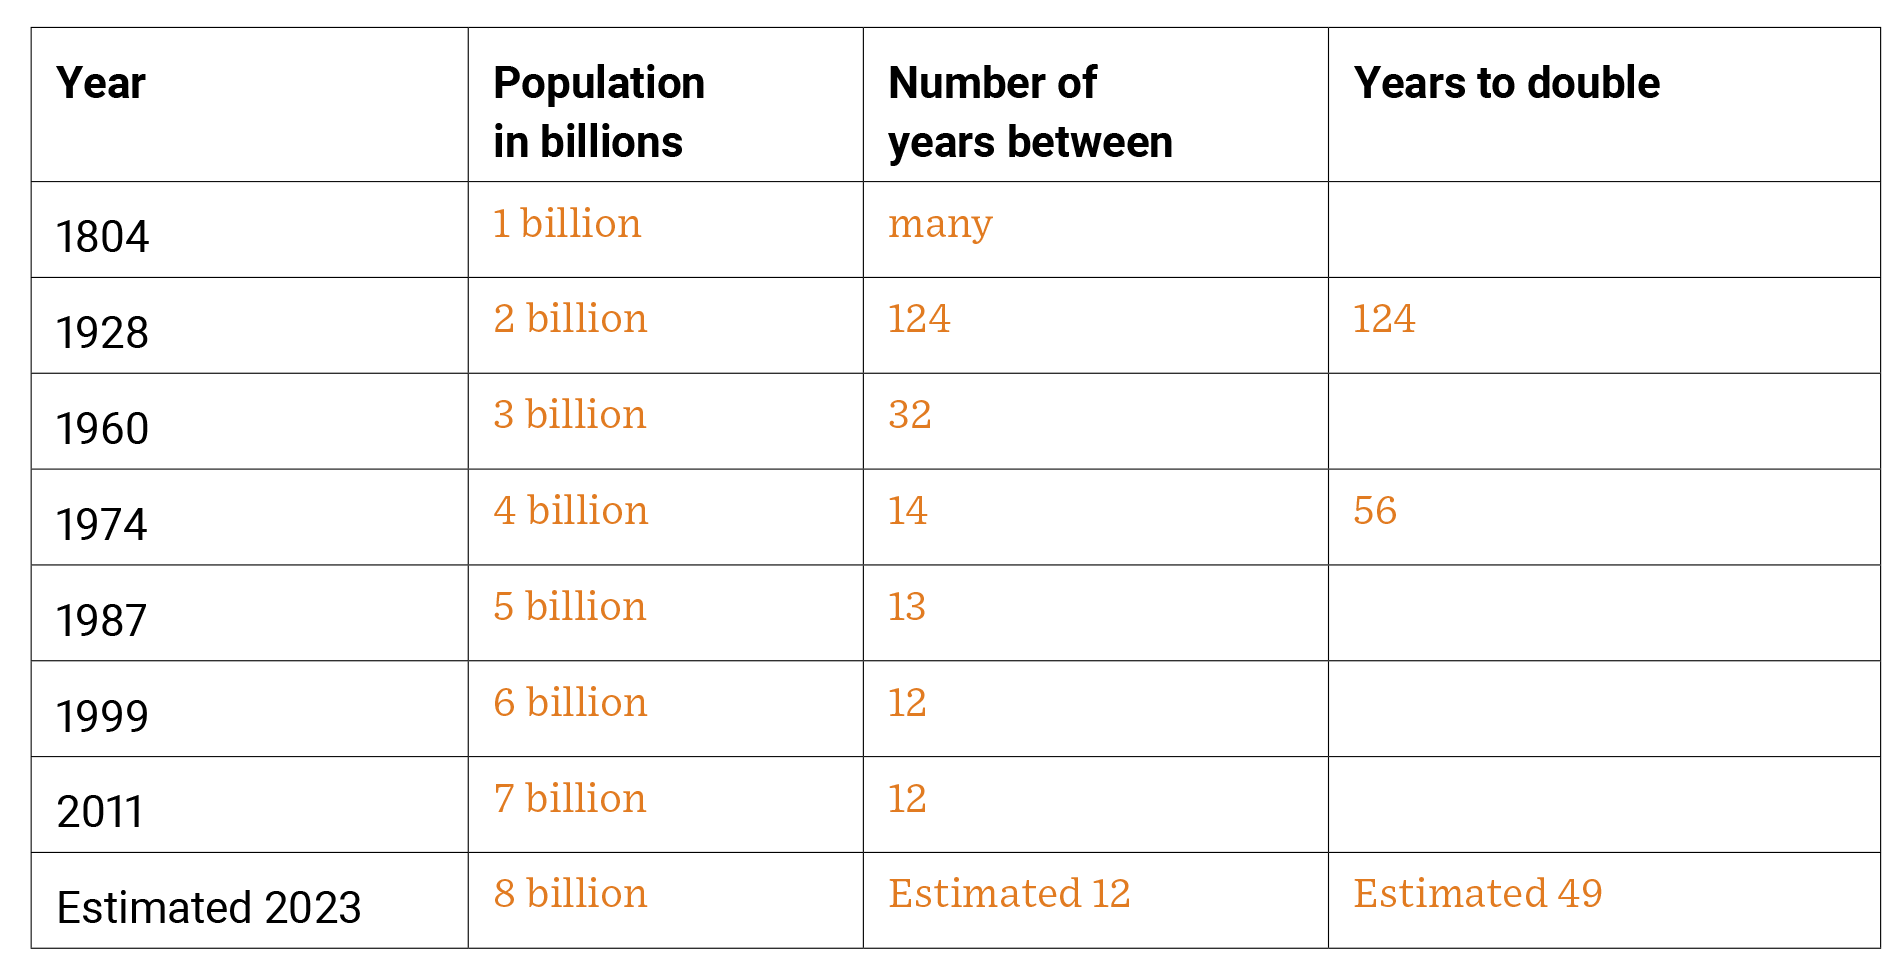
- How many years has it taken for the world population to double?
- How many years has it taken for the world population to increase by 1 billion?
- If needed, help students identify the information they should include in their graph to answer these questions. If needed, draw a blank table on the board (using the example below) to help students recognize the data they should collect to answer the questions.
- After students complete the Reflection questions on their handout, assess their learning by asking them to write a paragraph to address the following:
- Identify the factors that have the largest effect on the carrying capacity of an ecosystem for a human population.
- Identify any interdependence of factors (both living and nonliving) and the resulting effect(s) on carrying capacity; use evidence to support your explanation.
- Refer to the Population Growth—Teacher Key to find options for differentiation in the classroom, answers to the reflection questions, and a rubric to evaluate the assessment.
Activity 2: Population Age Structures
What is an age structure diagram? How does age structure affect population growth? Why is this important in food production?
- Give each student one copy of the Population Age Structures student handout.
- Introduce the focus questions found at the top of the handout and instruct students to follow the instructions to complete the handout.
- After students complete the handout, assess their knowledge by their responses to the following questions:
- Are there other models that would work as well or better?
- What factors do age structure diagrams take into account?
- Are these factors always going to be predictive of population growth?
- Refer to the Population Age Structures—Teacher Key to find options for differentiation in the classroom, answers to the reflection questions, and a rubric to evaluate the assessment.
Activity 3: Demographic Transition
What demographics change as economies develop? How does demographic transition affect the kinds of foods and resources demanded?
- Watch the video, A global food crisis may be less than a decade away | Sara Menker. This video helps to describe a different way of framing the question “How do we feed 9 billion people in 2050?” Sara Menker uses calories and lists which countries are net calorie exporters and which are importers of calories. It helps to explain the
economic conditions that lead to demographic transition. - Give each student one copy of the Demographic Transition student handout.
- Instruct students to complete the handout. Note that this handout includes information about the same countries highlighted in Activity 2. Students will get a comprehensive view of the countries by researching the factors that contribute to population growth along with the economics in order to create a computational model to describe trends within, among and between countries. This lesson is designed to be assigned to each individual student. They should research information on multiple countries in order to create the spreadsheet to show relationships.
- To assess student comprehension, ask students to develop a computational model to compare these data points (i.e. compare the data from each country to other countries to determine if relationships exist between countries; and compare the effects of certain pieces of data on others). Include data that were researched as well as those that were supplied. Include other factors that you think may have an effect. For example: If the growth rate of a population changes, what effect might that have on the number of calories consumed? How about on the use of freshwater per person per year? (See sample spreadsheet at the end of this document for a beginning/developing/statisfactory/exemplary chart comparing 2 countries.)
- What are the negative impacts of increased production and consumption of food resources?
- How have we tried to address these impacts?
- Refer to the Demographic Transition—Teacher Key to find options for differentiation in the classroom, answers to the reflection questions, and a rubric to evaluate the assessment.
Activity 4: Farming for the Future
How many people farm in the world? What are the practices that the majority of global farmers use?
- Give each student one copy of the Farming for the Future student handout.
- Divide the class into groups of 3-5 students. Introduce the students to the activity by letting them know that they will be making farming decisions as a "village."
- Give each group one six-sided die, Effects of Malnutrition chart, and Data Sheets for year 1, 2, and 3.
- Instruct students to follow the step-by-step instructions to complete the activity. Place your classroom sets of Impact Cards in your classroom for students to use. Be sure to label and keep the Year 1 and 2 cards separate from the Year 3 cards.
- Refer to the Farming for the Future—Teacher Key to find options for differentiation in the classroom, answers to the reflection questions, and a rubric to evaluate the assessment.
Elaborate
-
Watch Population & Food: Crash Course Geography #16. This video illustrates the link between population and food energy to begin seeing the complexities of a growing population and providing enough food and water for everyone while supporting a sustainable environment.
-
Watch Hans Rosling: Global population growth, box by box to see how raising the living standards of the poorest can impact population growth.
-
Show students an example of Subsistence Farming in Have, Ghana. Discuss the challenges of this farming method compared to commodity farming in developed countries.
Evaluate
After completing these activities, review and summarize the following key concepts:
- The world population is increasing. Demand for food, natural resources, and infrastructure to sustain a growing population will require a careful look at sustainability.
- Food waste decreases sustainability. Food waste can occur on the farm with losses due to pests or at the consumer level when food is thrown away.
- Subsistence farming is a method of farming where families and villages rely on their own farms for food. Commodity farming is more common in developed nations.
Sources
Acknowledgements
This activity is an excerpt of the Populations unit created by Nourish the Future.
Recommended Companion Resources
Author
Organization
 |
We welcome your feedback! If you have a question about this lesson or would like to report a broken link, please send us an email. If you have used this lesson and are willing to share your experience, we will provide you with a coupon code for 10% off your next purchase at AgClassroomStore. |